Toolbar
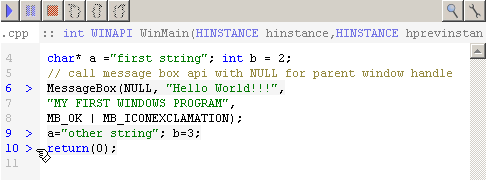
Starts the Xcc process (Set options in the configuration panel to enable or disable parts of the process)
Break
Stop the Xcc process (compiler, linker or debugger)
Step into
Step over
Step out
Refresh all panels & locate source line (not necessary, useful if you navigated away)
The edit box following this icon is a command line pipe-interface to a live debugger
This button toggles the variable watch pane. (to add or remove live variable watch)
Toggles the selected Xcc node's configuration panel
Breakpoint Tab
Descendants of an Xcc node have a breakpoint tab left of the body pane. Click it to add, remove, enable or disable breakpoints in your code.
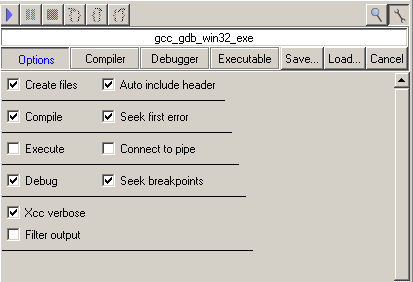
Options Panel
These options tell the Xcc node what to do when the 'Play'button is pressed.
To get some work done, create, compile and debug are checked along with seek breakpoint and errors.
Auto include header puts #include projectname.h at the start of the source.
Create Files will derive the appropriate .h, .c or .cpp files from your outline.
Compile will invoke the compiler, creating intermediary object files.
Link will invoke the linker, creating an executable.
Execute will run your program.
Debug will run your program through the debugger.
Seek errors and breakpoints will unfold the outline to find and highlight breakpoint and error lines while compiling, or running through a debugger.Watch Panel
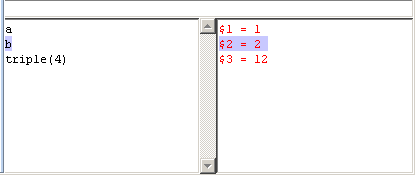
Use this to evaluate variables or expressions while running & debugging your program.
Enter a variable name or an expression in the edit box to watch its value.
Select those entries who become irrelevant and press delete to remove them.


